Prompt to Dashboard
Making Bliss Point’s dashboard builder the obvious choice over Claude
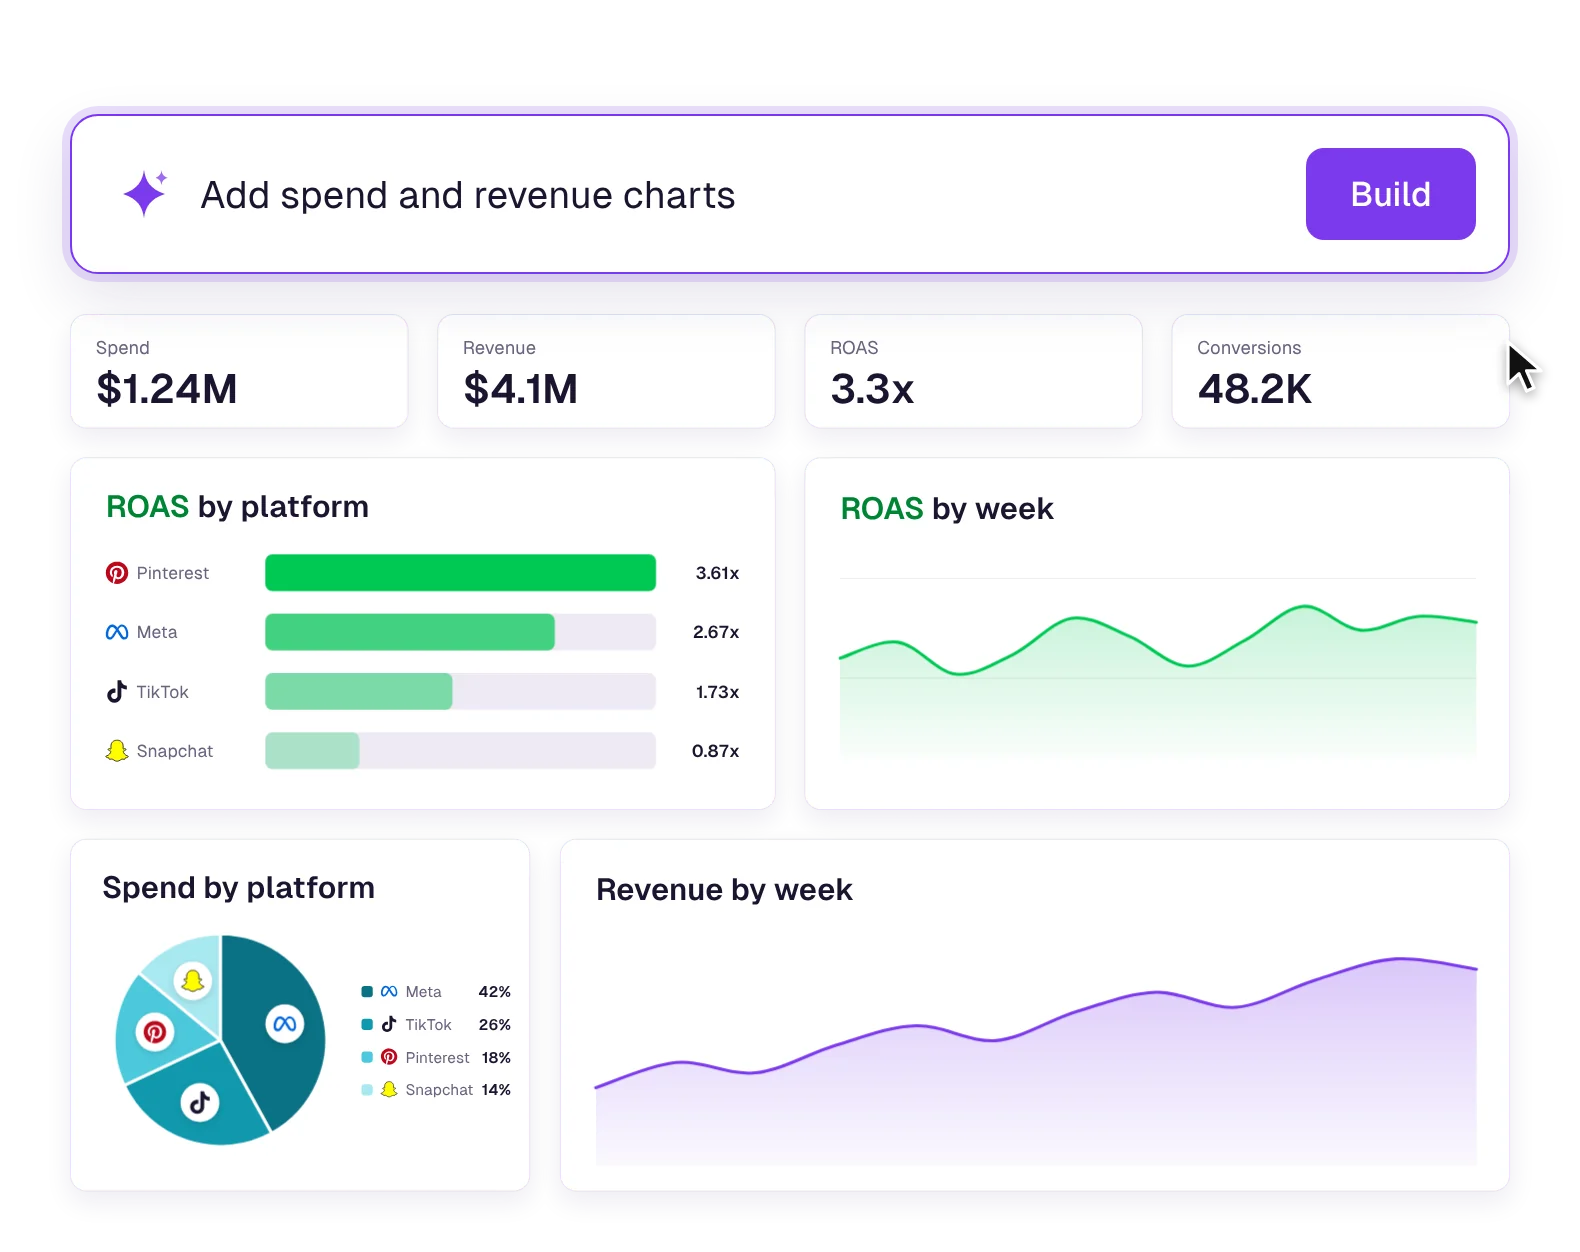
Type what you want to see and get a client-ready dashboard in 30 seconds instead of an hour.
 by

- faster than building a dashboard by hand
- 120×
- faster than building it in Claude
- ~30×
- initiative at the company this year
- Largest
The problem
Every client needs a different dashboard, and people were already building their own in Claude, off brand and sometimes with wrong numbers.
What I did
Director of Product Design at Tinuiti, on the Bliss Point platform
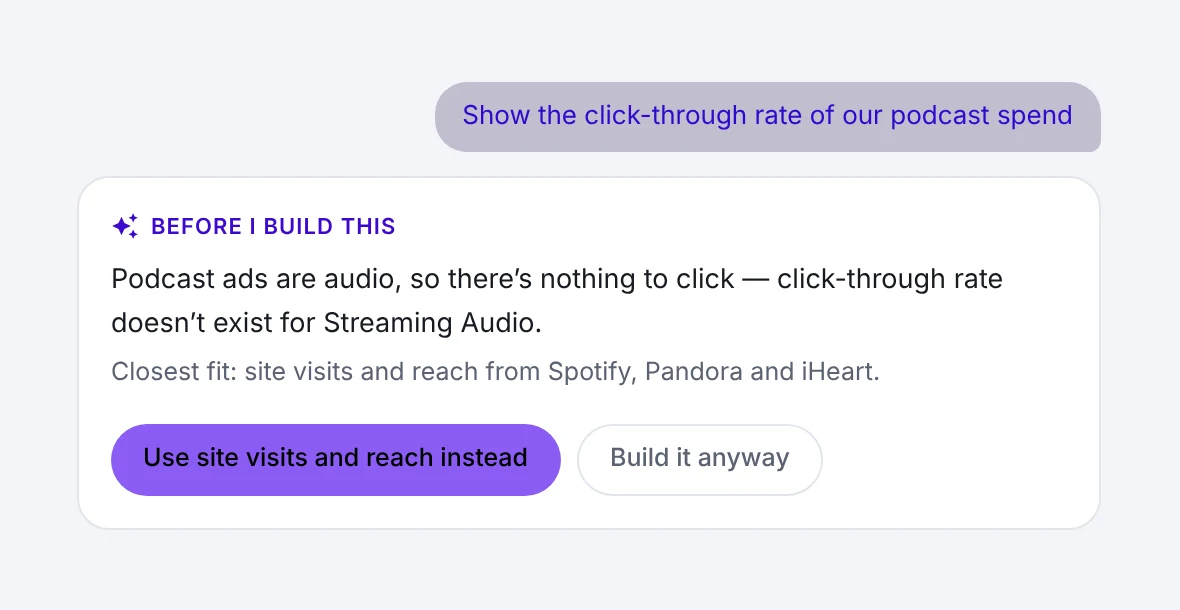
I pitched and designed a builder where you type what you want and AI assembles the dashboard from our own components and data, and says so when a request doesn’t make sense.
Bliss Point powers 300+ brands, including









Try it first
Hit New Dashboard, pick the podcast clicks prompt and press Build. Made-up data for a fictional client.
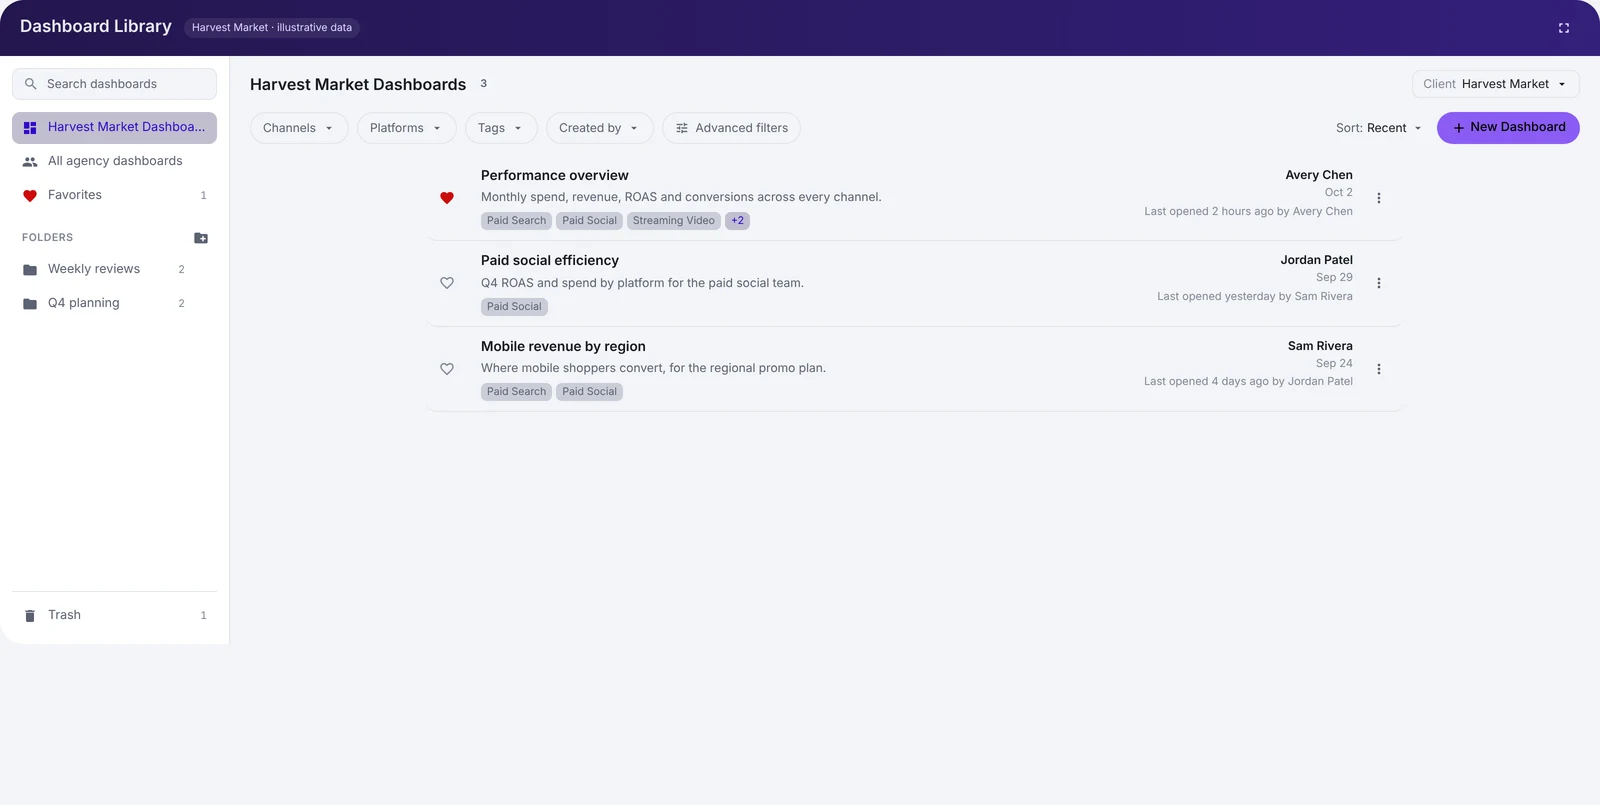
Dashboard Library
Harvest Market · illustrative dataHarvest Market Dashboards3
Performance overview
Monthly spend, revenue, ROAS and conversions across every channel.
Avery Chen · Oct 2
Paid social efficiency
Q4 ROAS and spend by platform for the paid social team.
Jordan Patel · Sep 29
Mobile revenue by region
Where mobile shoppers convert, for the regional promo plan.
Sam Rivera · Sep 24
The real tool lives behind Bliss Point’s login, so I recreated it here. Want to see the Figma files? Just ask.
Background
One dashboard for everyone.
Bliss Point is a massive marketing analytics platform. It works with an incredible amount of data and serves people across many marketing disciplines, and no two clients need the exact same thing.
Its original ethos was the opposite: one curated layout for everyone, so everybody knew what to expect. It showed the data clearly and beautifully, and leadership loved it.
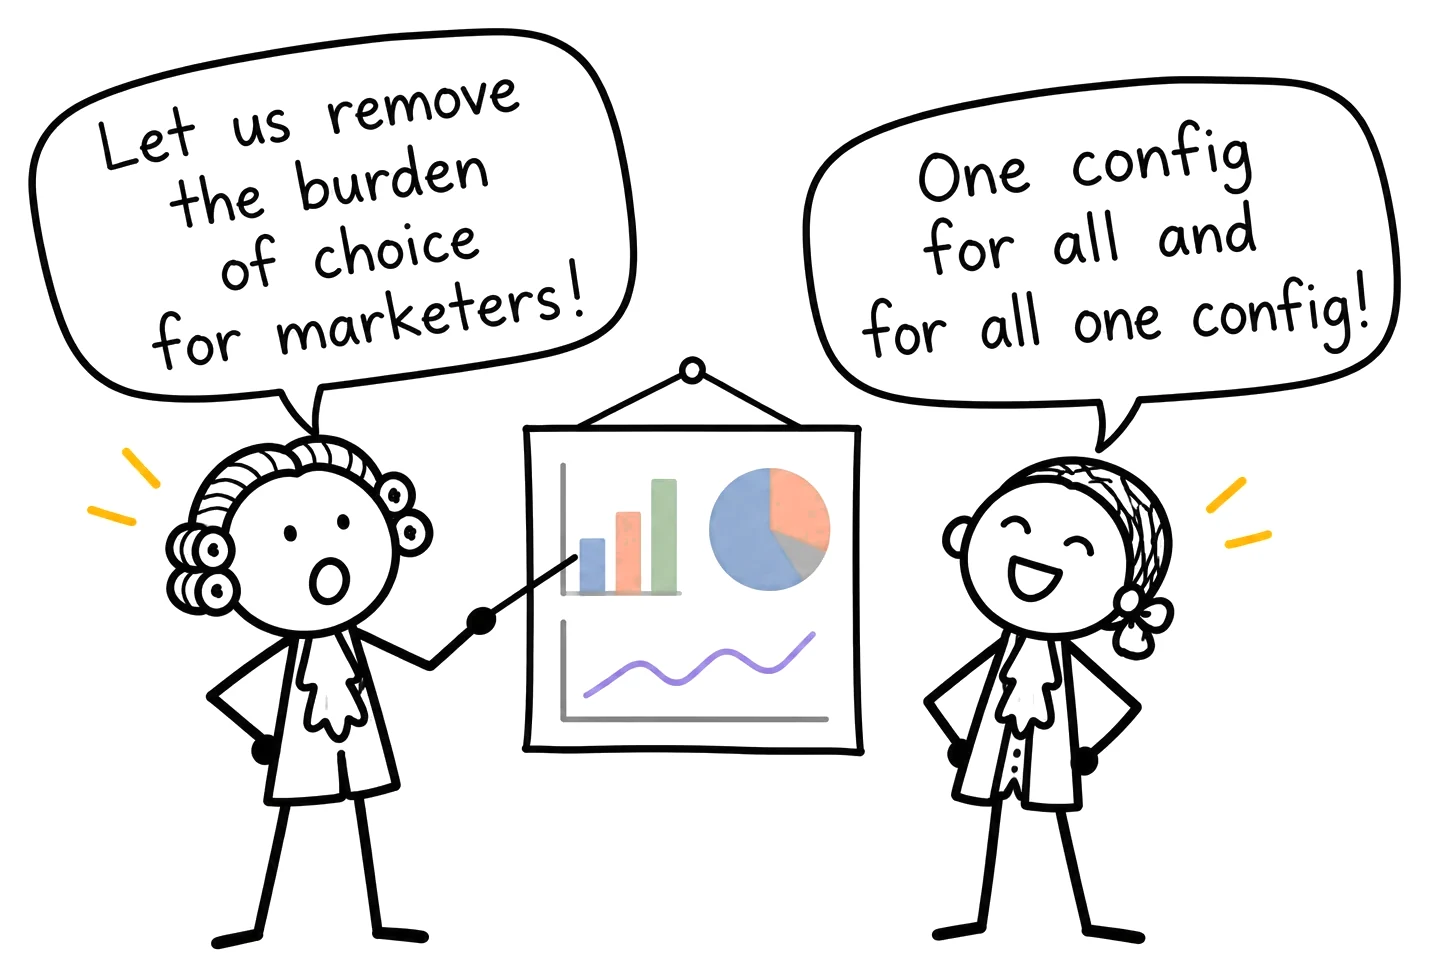
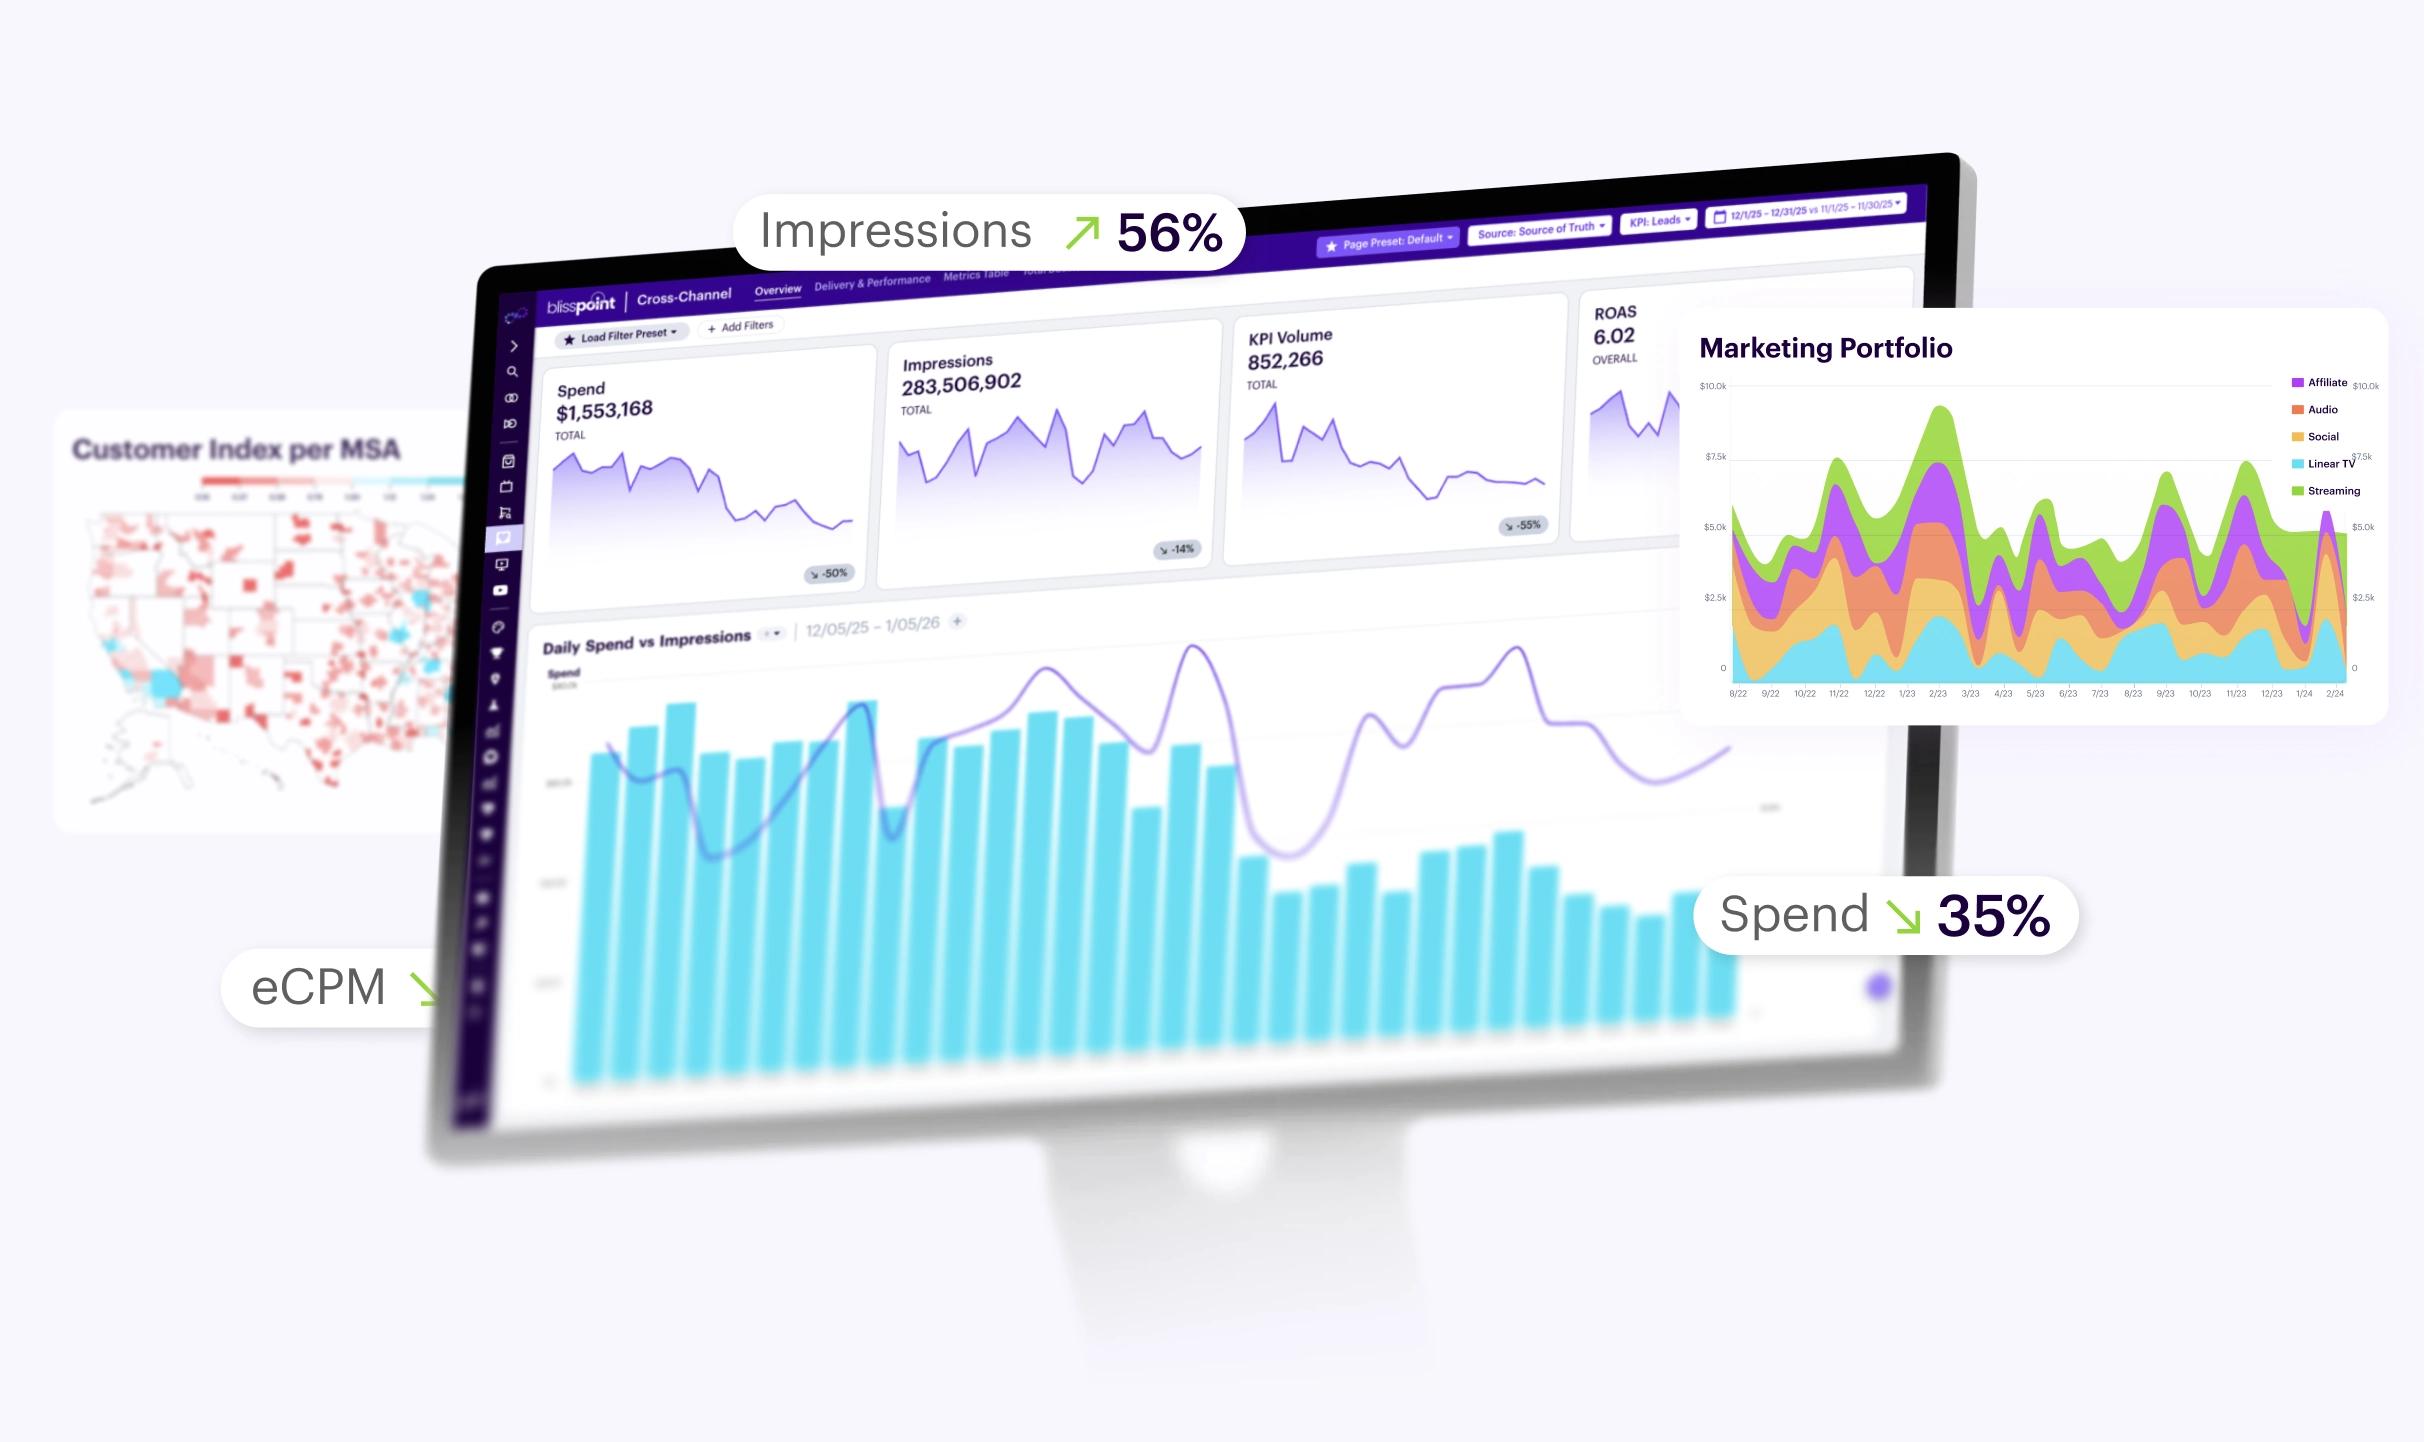
But one size fits all causes more problems than it solves. To meet user and client needs, Bliss Point has to be dynamic.
The problem
Every client needs a different dashboard.
Tinuiti manages close to a thousand clients. Big ones, too. You’ve seen their Super Bowl commercials (like this one from Ramp).
People check client performance at least weekly: campaigns, targeting, click-through, conversion, spend. Bliss Point is the source of truth for them and for their clients.
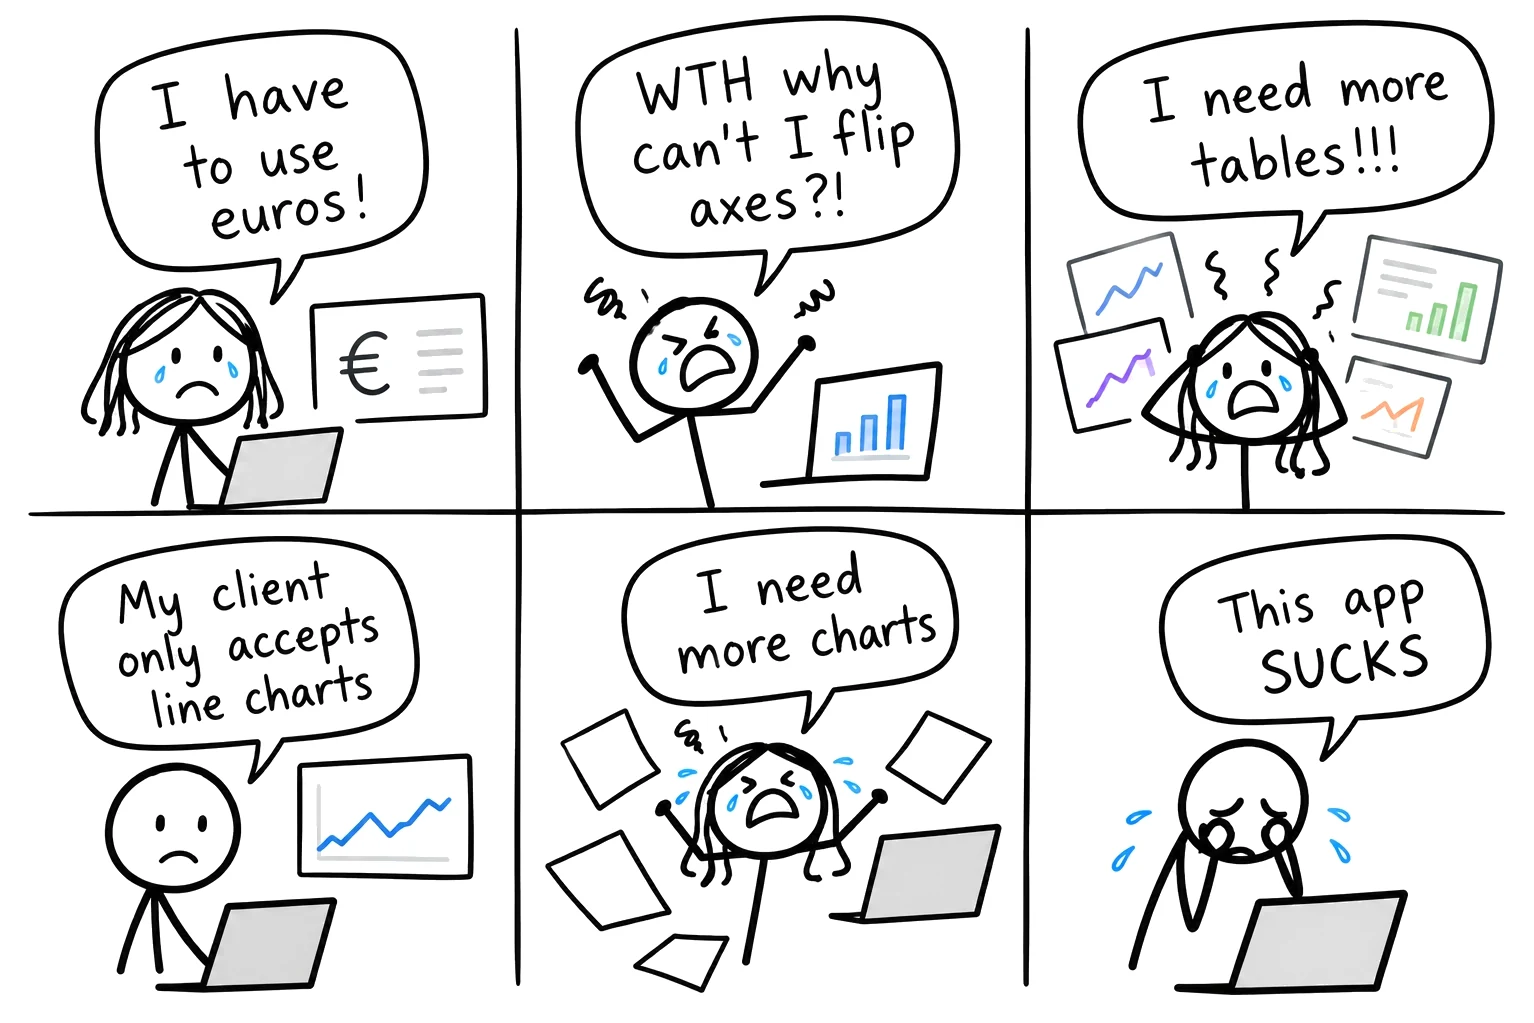
A client optimizing landing page conversion needs a different picture than one dialing in Meta and Google spend, or one measuring a new national TV spot.
One team wants spend and ROI in one table. Another wants them side by side. Another needs none of it.
Every client needs a tailored dashboard, and it has to feel intuitive to every user.
The catch
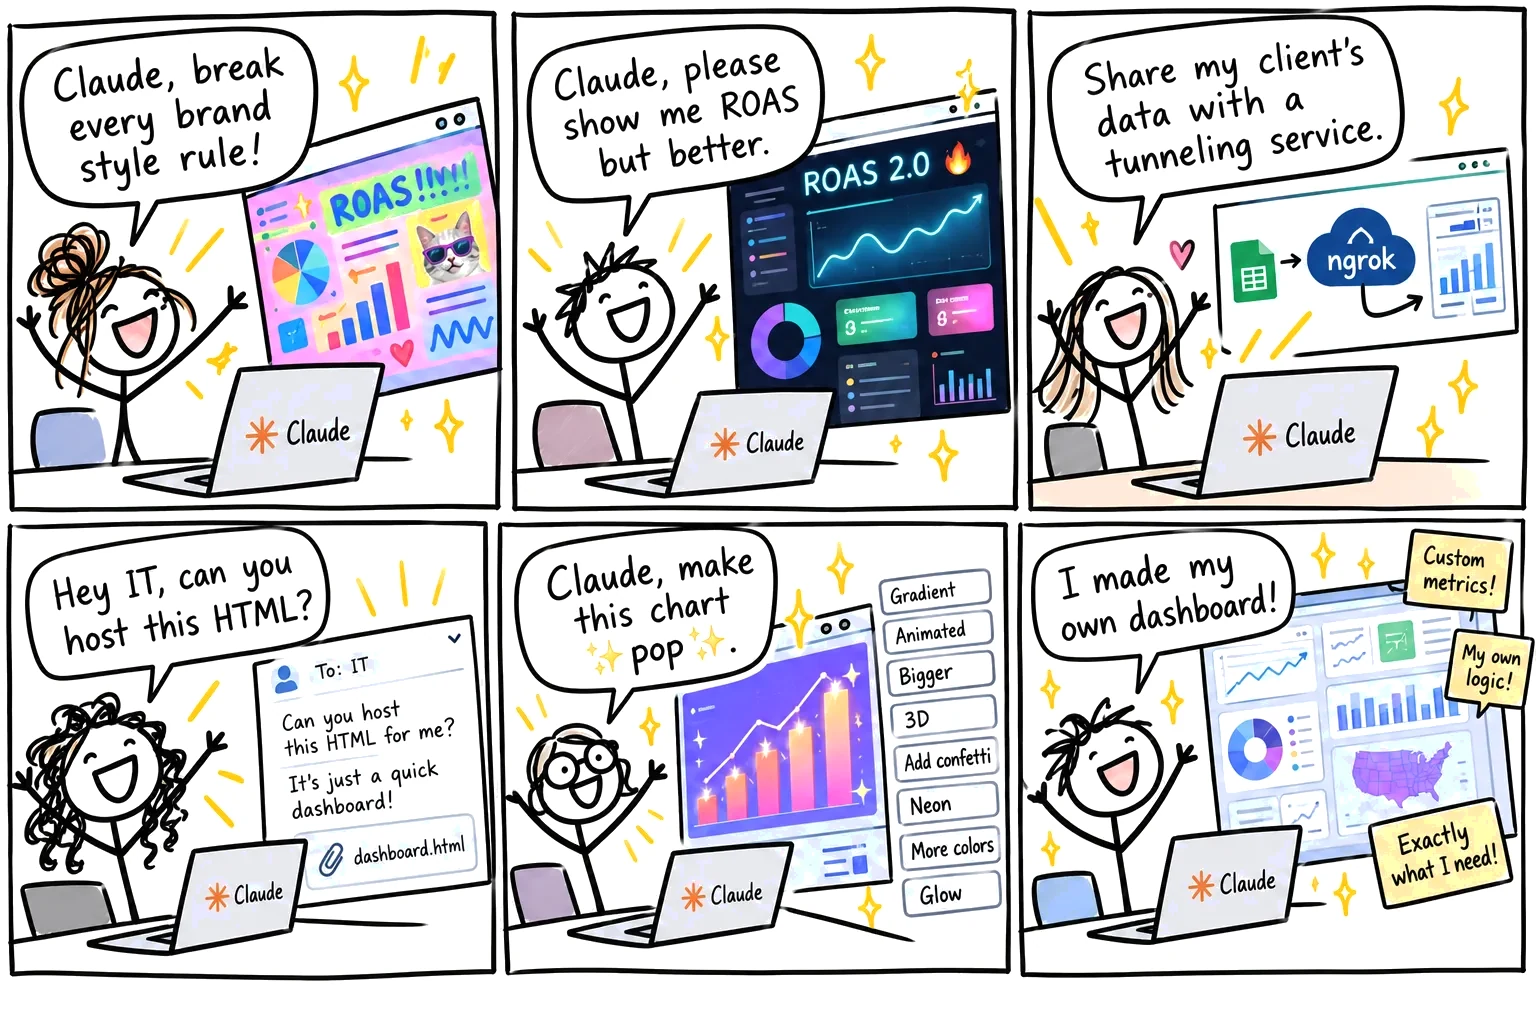
People were already building their own in Claude.
People at Tinuiti were already using Claude, Gemini and ChatGPT to make slides, sales decks and HTML pages. Plenty of people had started making dashboards too. AI is fast and gives people what they want as fast as they can ask.
But those dashboards were inconsistent at best and inaccurate at worst. Branding suffered. Readability was hit or miss. Data integrity went right out the window.
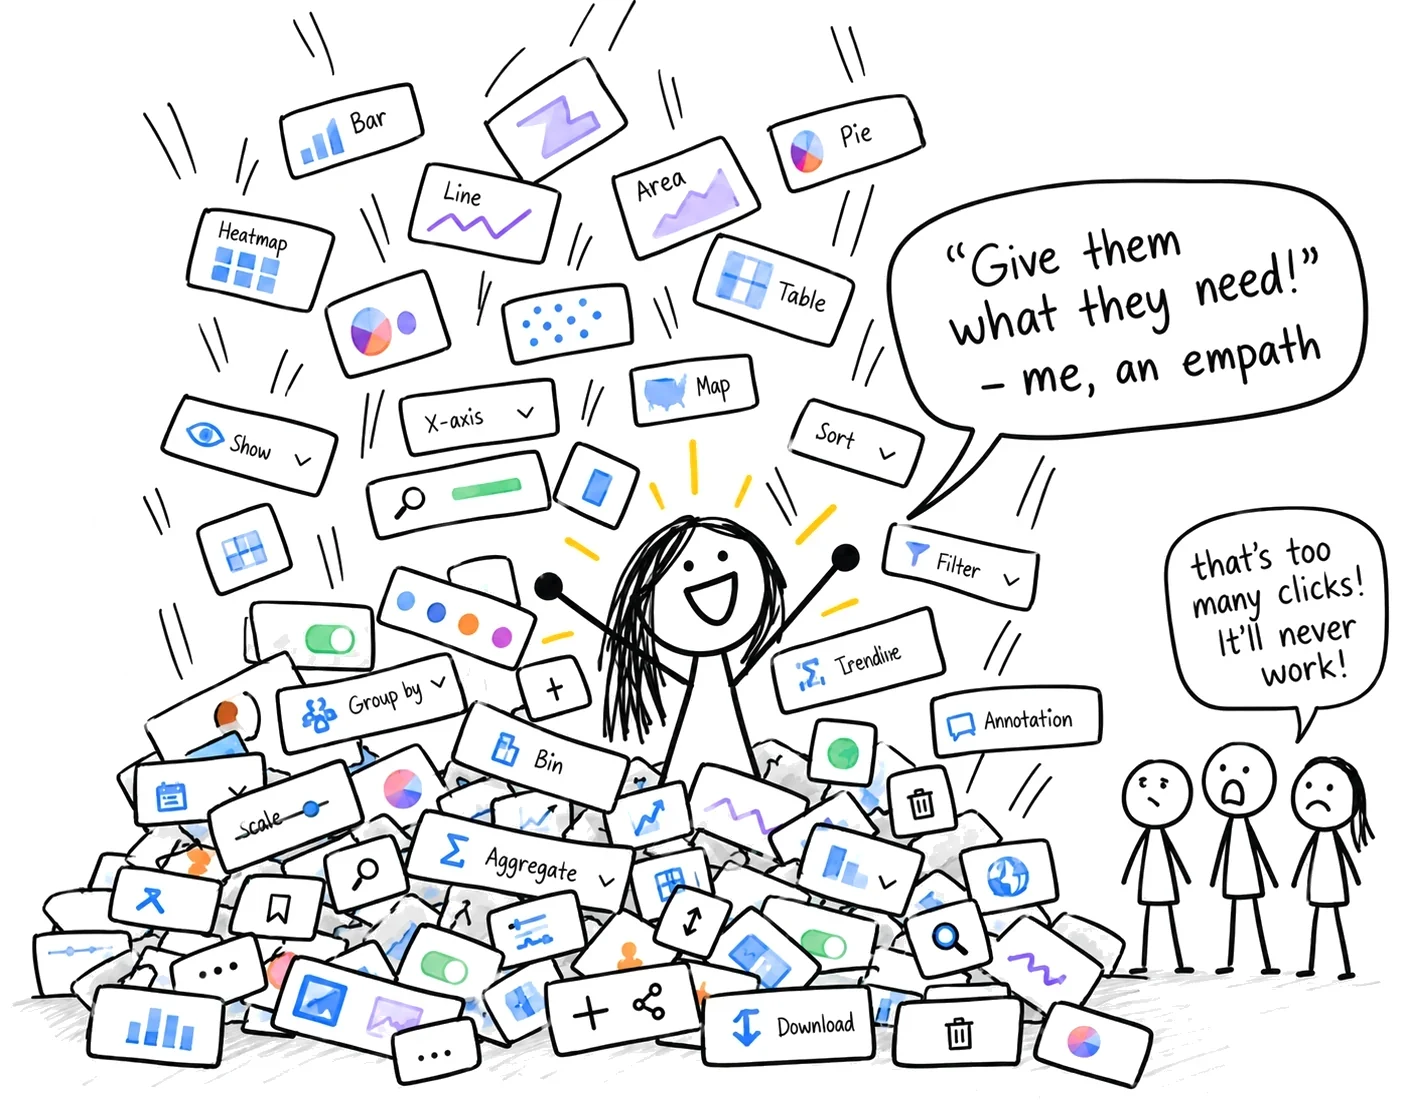
The obvious fix, piling on chart settings, wouldn’t work either. Too many clicks. And engineering can only support so many kinds of charts, so whatever we built had to stay inside one flexible framework.
It had to beat what people were doing in Claude
Accurate
Real client data, no made-up numbers.
Consistent
Titles, legends, colors and tooltips that work the same on every chart.
Just as easy
Ask in plain words, like people already do with AI.
Shows its sources
Marketing data comes from conflicting places, and people need to know which.
The pitch
I pitched it twice.
- 1
I pitched configurable dashboards.
About two years earlier, so people could shape a dashboard to fit each client.
- 2
We went with curated ones instead.
They were faster to build.
- 3
People didn’t stick with them.
They went back to spreadsheets and slides, and then to Claude.
- 4
I pitched it again, with AI.
Describe the dashboard, and it’s built from our own parts. I pitched and designed it with no PM.
- 5
It became the company’s largest initiative of the year.
Now in alpha.
The solution
Describe it, and AI builds it from our own parts.
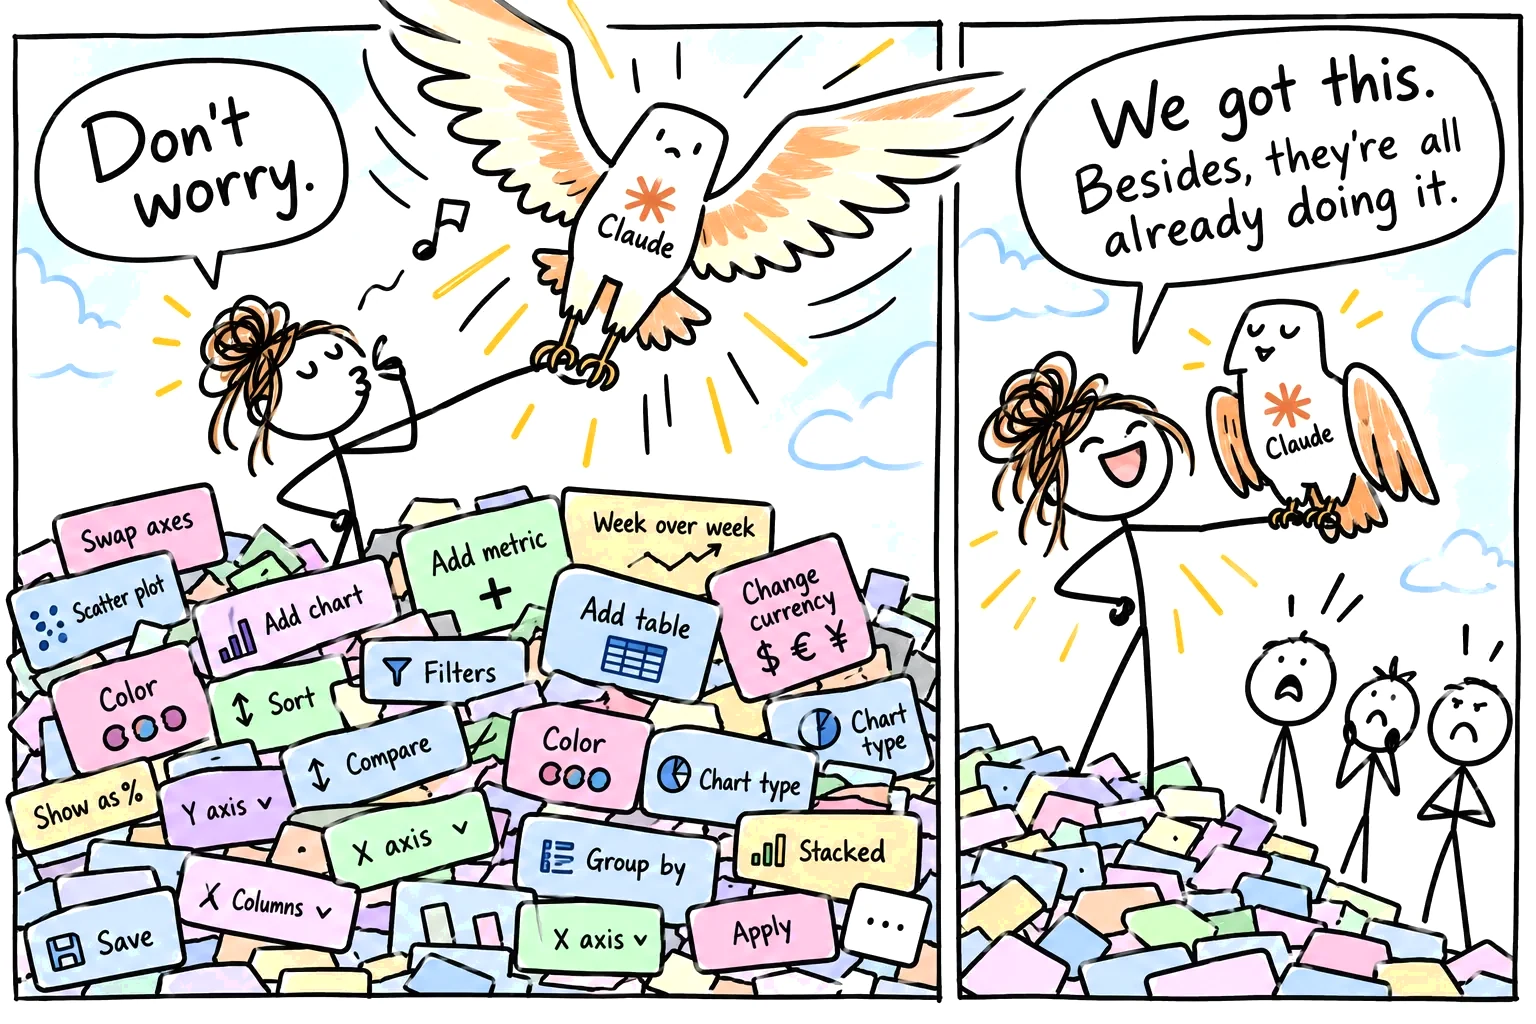
I designed exactly what people were already doing, minus the mess: a dashboard you build by describing it. If you’re an AI nerd, think of it as a RAG-based design system with a layer of data connections on top.
If you’re not, imagine prompting for what you want and getting consistency and accuracy without hallucinations.
Ask for a dashboard
Try both kinds of request: one that works, and one that can’t exist. (Made-up numbers.)
Inside a built dashboard
Tap a number to see the thinking behind that detail.
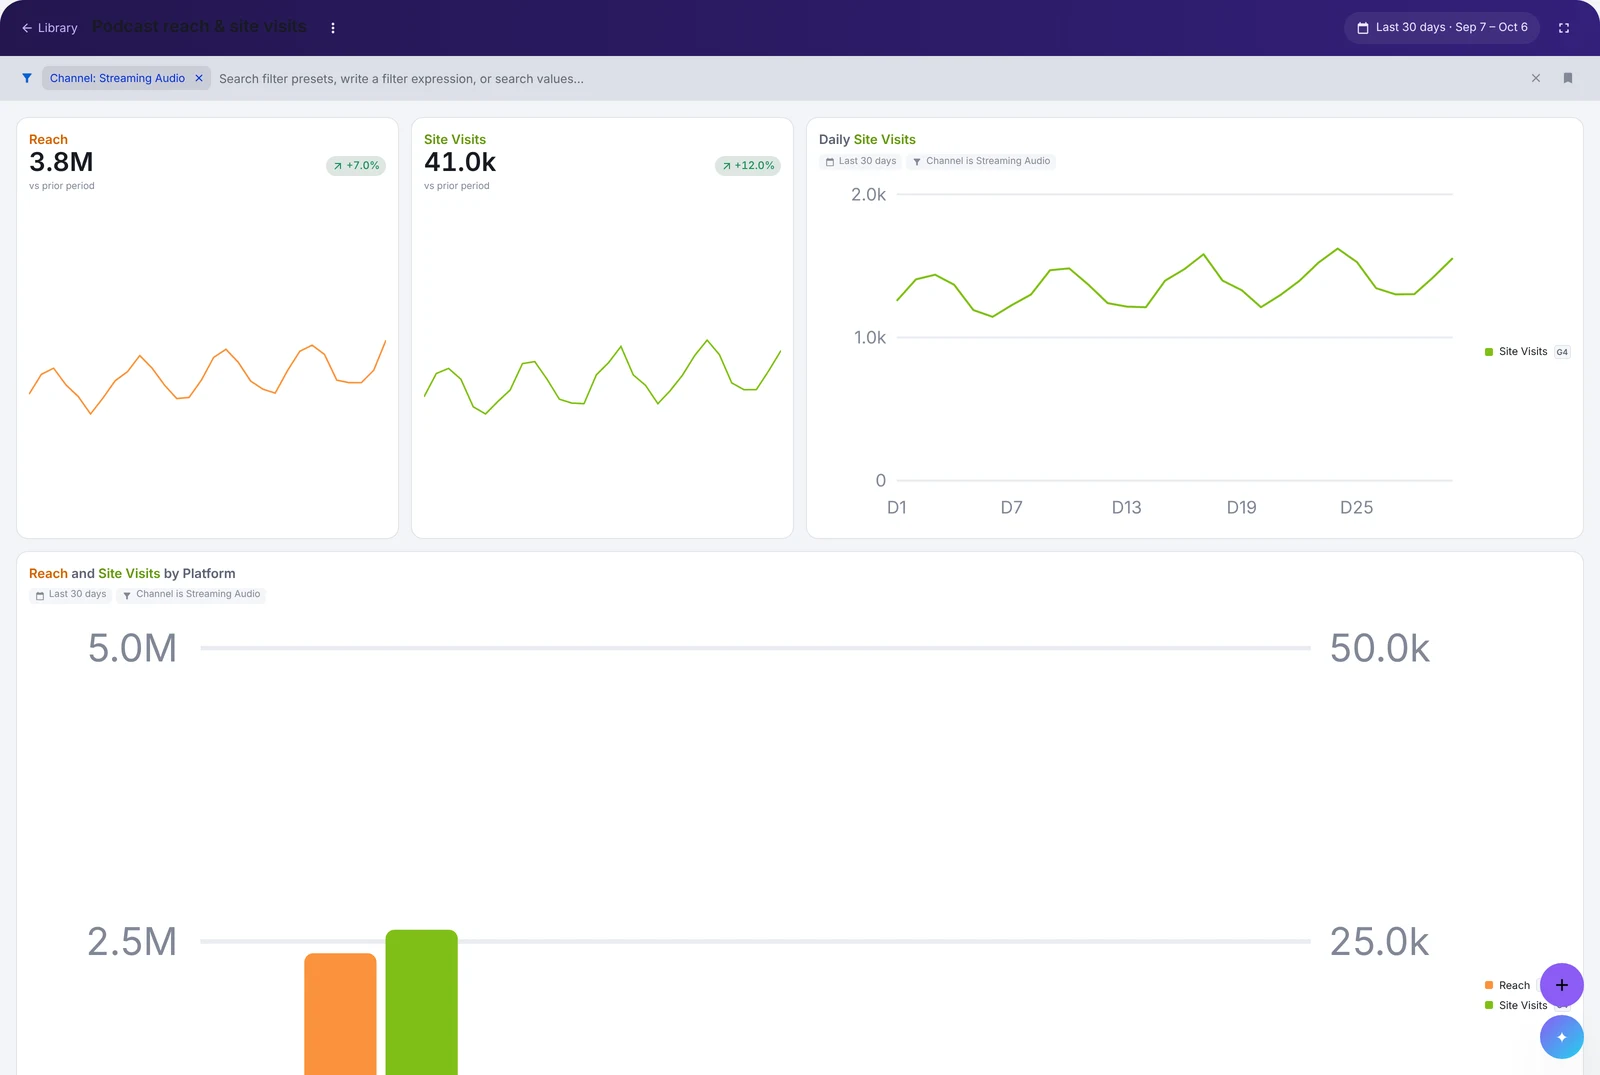
The result
In alpha.
The company’s largest initiative of the year.
- faster than building a dashboard by hand: 30 seconds instead of an hour
- 120×
- faster than building it in Claude, which takes about 15 minutes
- ~30×
Accurate and on brand, every time
Dashboards meet data, client and brand standards.
Shareable outside the company
Unlike with Claude, people can share and export them, which has improved client communication for alpha users.
Alpha users say it’ll make their work much faster and easier.
Want to talk through this project?
I’d love to walk you through it, including the parts I couldn’t show here. Ask me about:
- How the AI builds only from our own chart components
- What happens when a request doesn’t make sense
- How I pitched it, twice