Scenario Planning
Turning tables into a revenue simulator that people love
Put in a media budget, and a machine learning model predicts how much revenue it’ll bring in.
 by
 Built with

- it helped win in sales pitches
- New clients
- of major direct-to-consumer brands use it
- Dozens
- set of calculations per plan, down from billions
- 1
The problem
Google’s Meridian model predicts what ad spend will earn, but its math is hard to follow without a data scientist in the room.
What I did
Director of Product Design at Tinuiti, on the Bliss Point platform
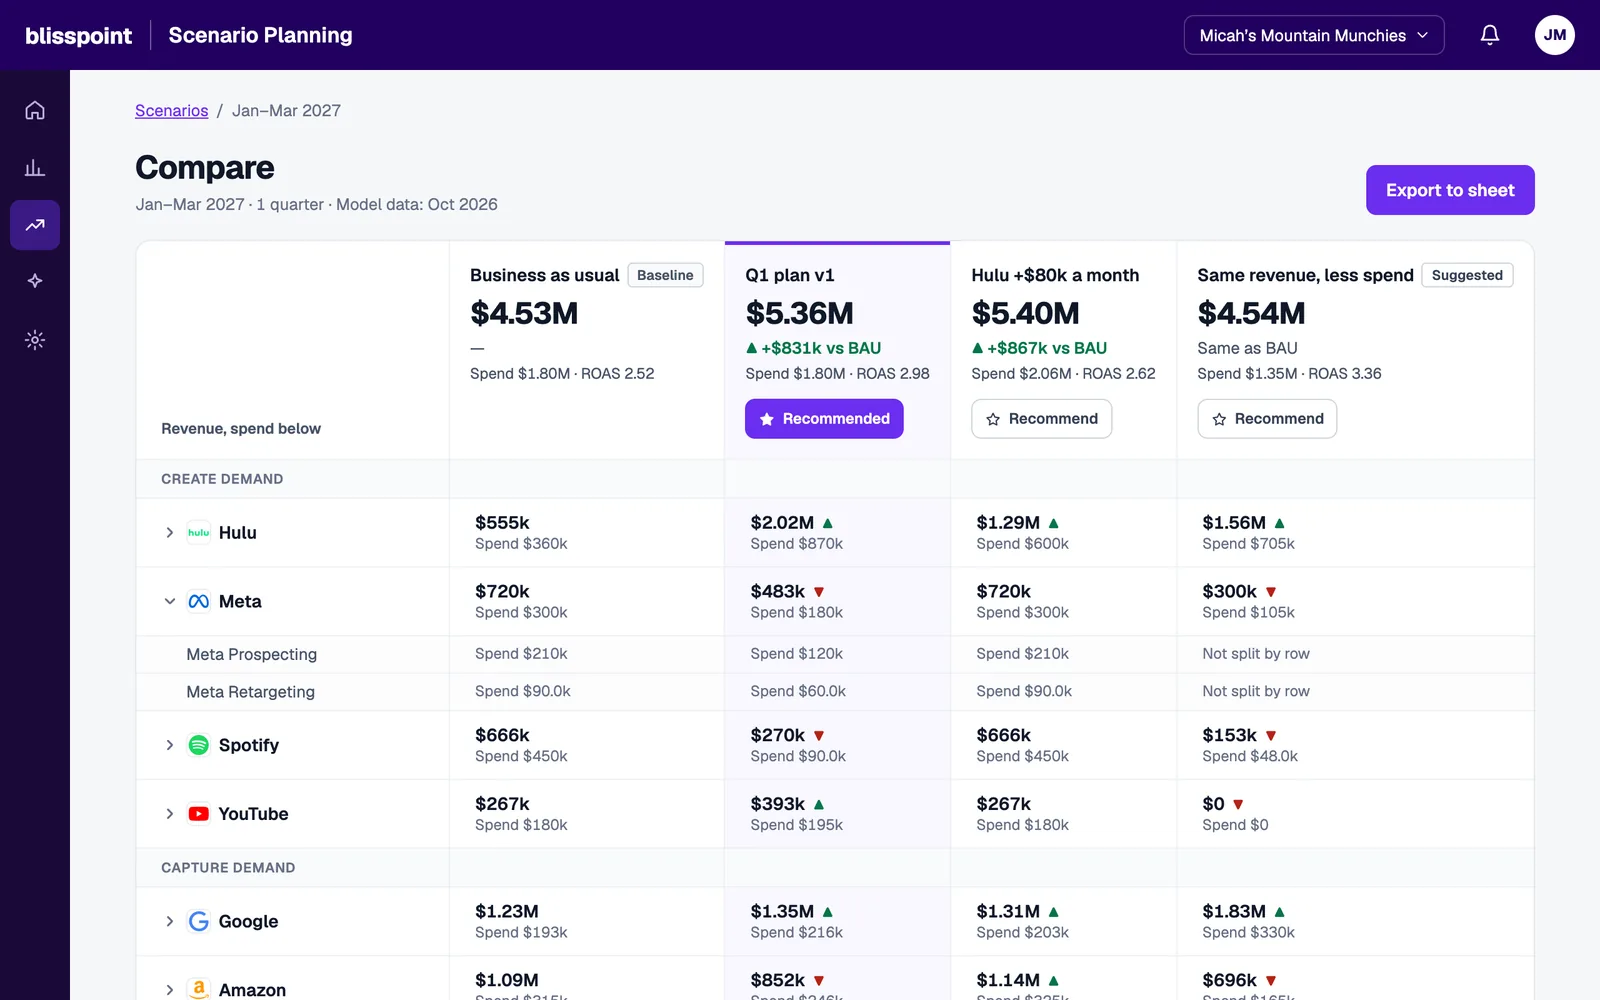
I designed a planner where account teams and their clients start from a spreadsheet budget, see predicted revenue in plain numbers, and compare saved plans side by side.
Try it first
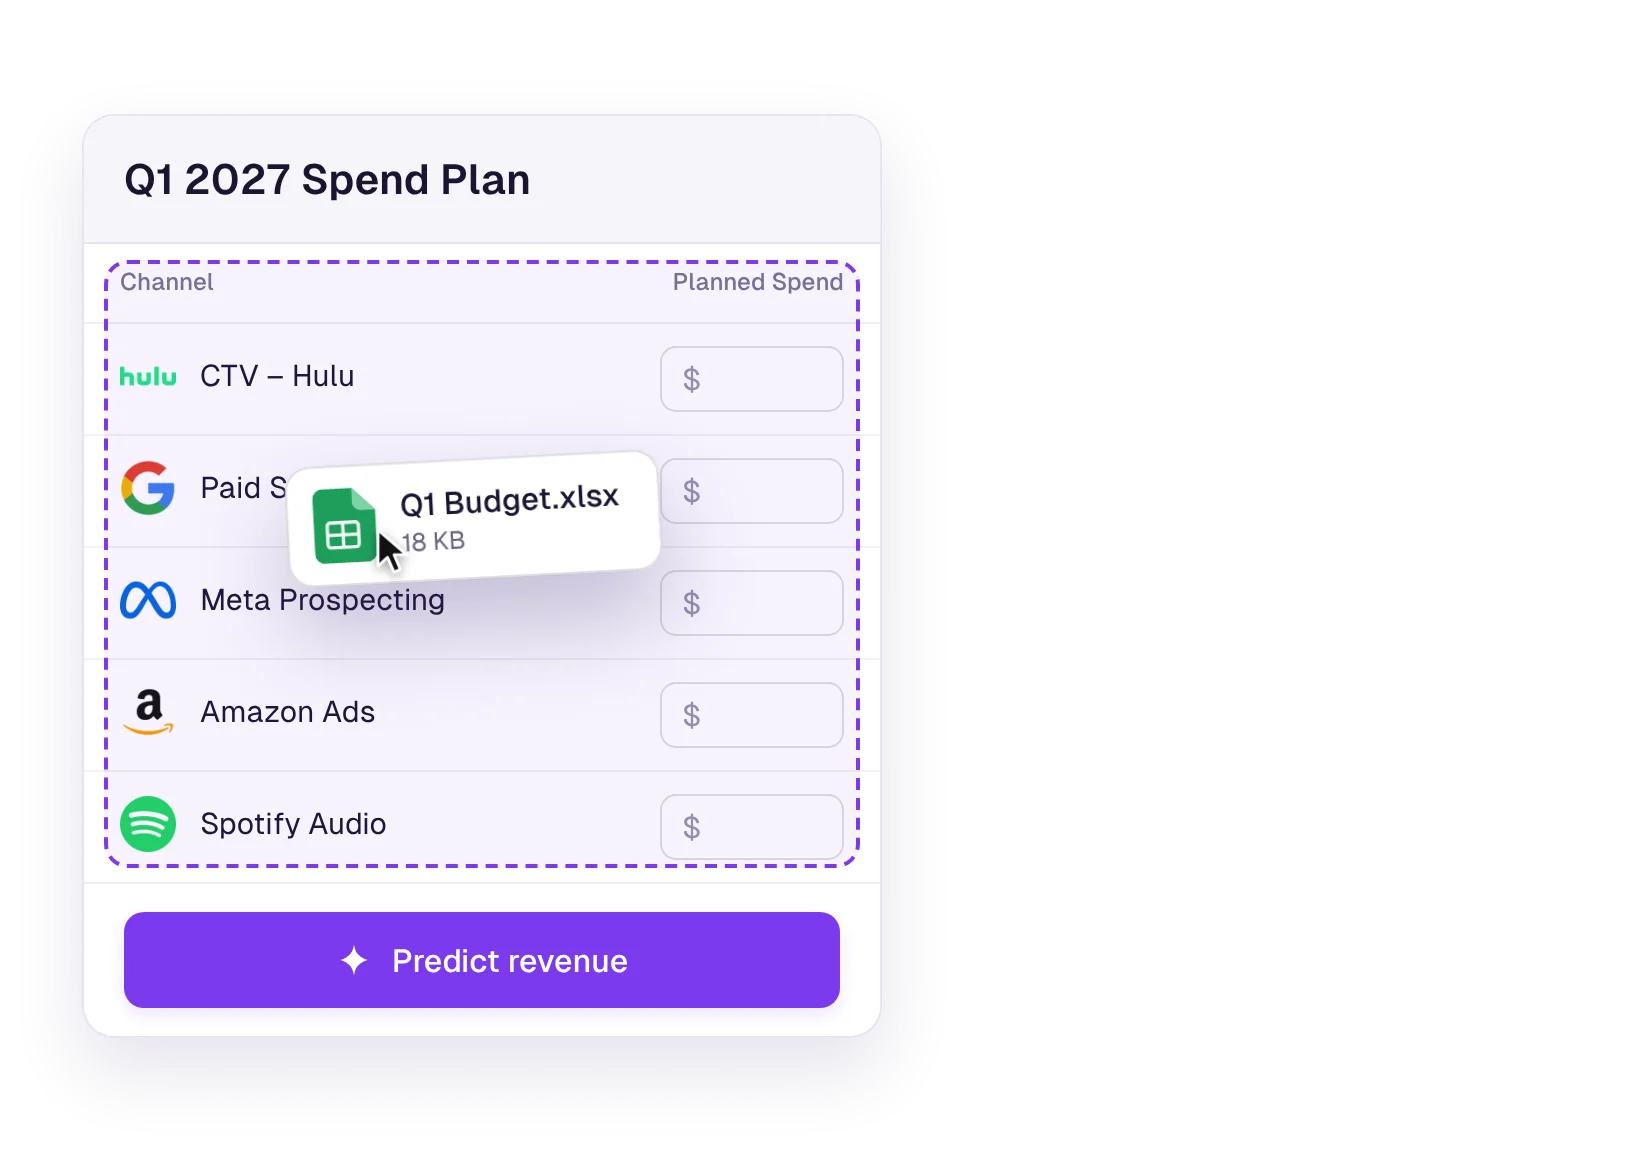
Start a new spend scenario, upload the sheet and predict its revenue. Made-up data for a fictional brand.
InteractiveVersion twoClick New spend scenario, then upload the sheet.
Open full size ↗Background
Where should the ad budget go?
Bliss Point is Tinuiti’s marketing analytics platform. More than 300 brands use it, along with the Tinuiti account teams who work on their marketing.
Scenario Planning is one of the tools in it. We built it with Google, on top of Meridian, Google’s model for predicting what ad spend will earn. I led the design.
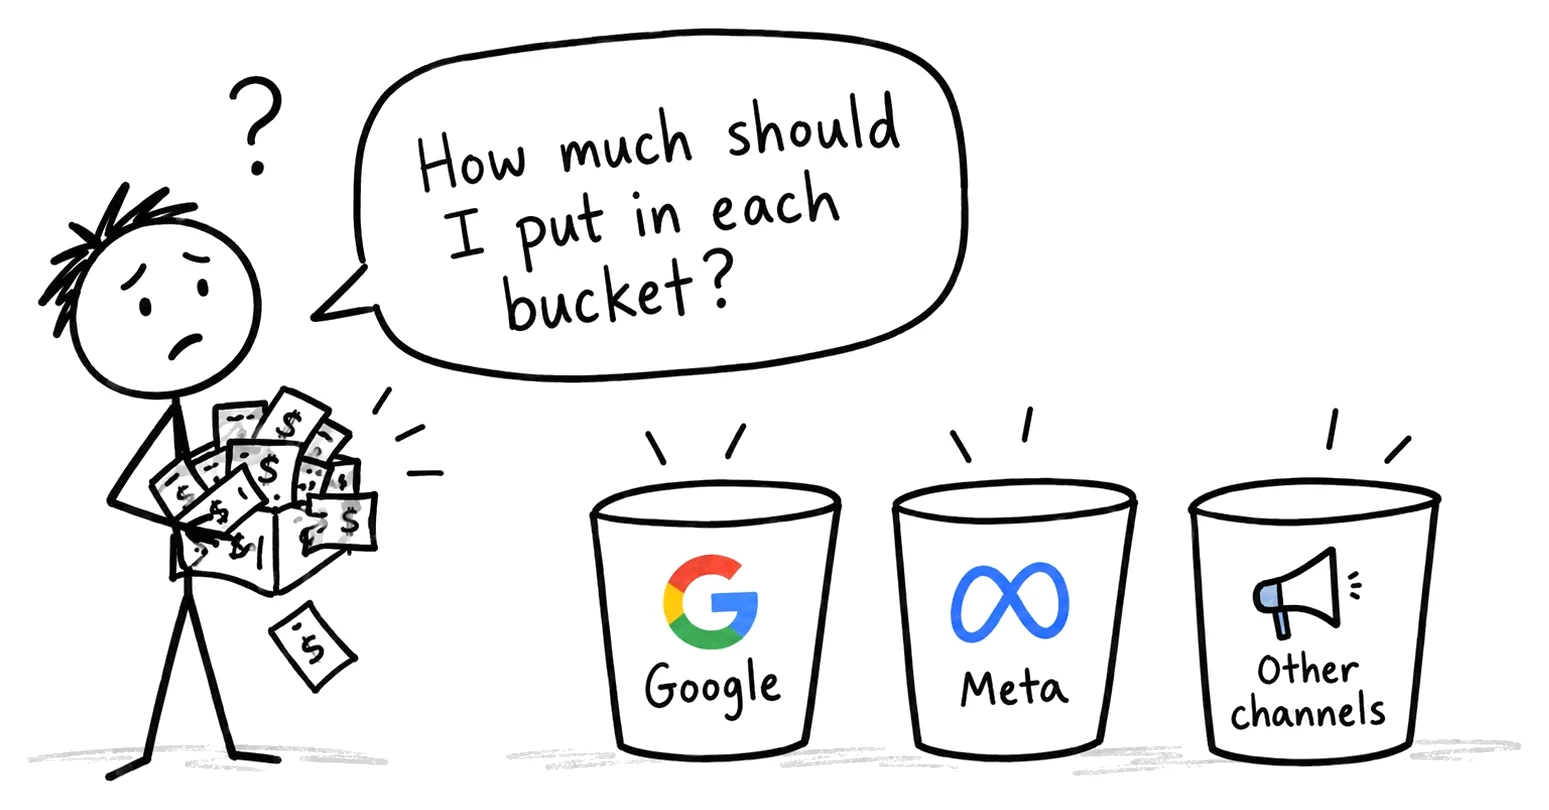
Marketers need to plan how to spend their budget each year. They need to know: if I spend X on Y channel, how much can we expect to earn in revenue? Is the juice worth the squeeze?
Sounds hard, right? (It was.) Here’s how I made it easy.
Before Scenario Planning
Budgets
Budgets lived in account teams’ spreadsheets.
Predictions
Predictions lived in Meridian, and reading them took a data scientist.
The problem
Google’s prediction model is hard to read.
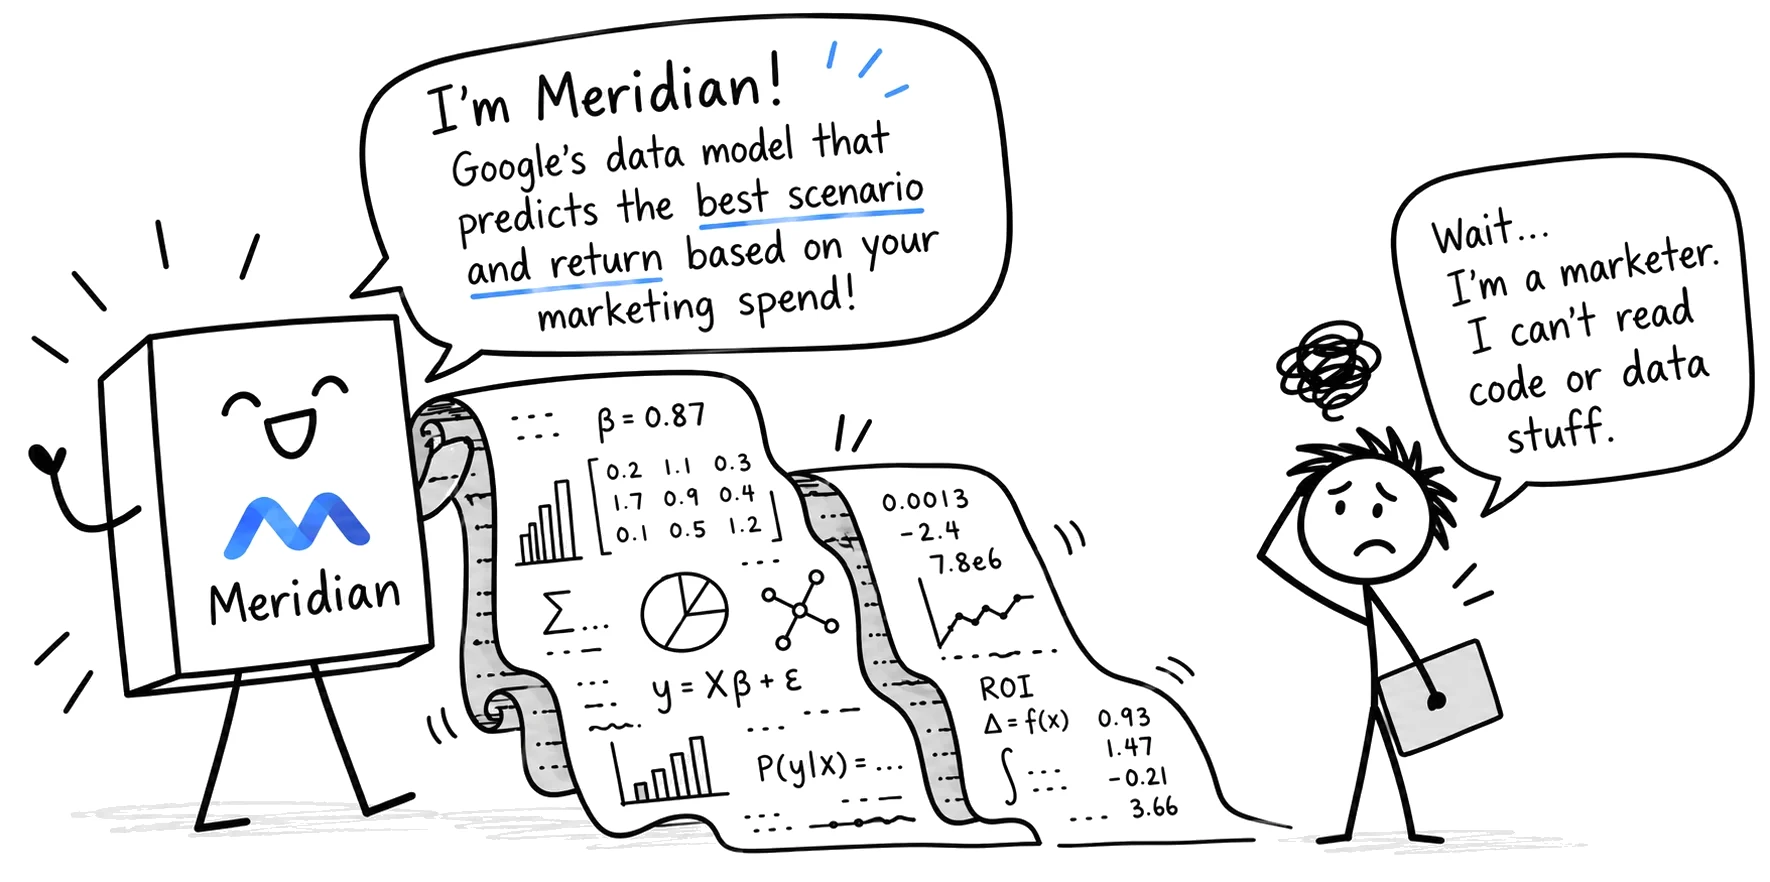
Google’s Meridian predicts the ROI of marketing spend. It can tell us that if we spend $5 on Meta, we’ll earn $15 on Meta and $15 on Google Search. But the math is hard to follow. Without a data scientist in the room, getting insights can be murky.
I needed to turn Meridian’s math into something intuitive for two audiences:
Our account teams
They work with each client’s marketing team. Scenario planning shapes their strategy, but they don’t use it often, so it had to be easy to pick up again.
Their clients
Everything had to be explainable to a non-expert. So clients get a simpler version, and account teams get more control over the model settings.
The tool had to do three things: take in spend amounts, show the resulting revenue, and keep doing that until you find your magic number.
The obvious answer
Live sliders.
You might be thinking: that should be easy. Just make a bunch of interactive sliders, so marketers can adjust spend and see revenue change in real time.
Well, you’d be right. That’s exactly what I did. It was easy and elegant, and everyone loved it. Try version one below: start a new spend scenario and drag any purple bar.
InteractiveVersion oneClick New spend scenario, then drag any purple bar.
Open full size ↗Only one problem
There was too much data.
The dummy data we’d used while waiting on Meridian was simple, so the sliders flew. The real data overwhelmed them.
Moving a slider meant crunching billions of calculations on the fly. It was slow, expensive, and completely untenable.
The solution
Upload the spreadsheet they already use.
I met with the Data and Engineering teams to work through our options. Even 4 points along a slider meant a billion data points and about 30 seconds of lag. Sliders were out. We needed to touch the data only once the whole plan was set.
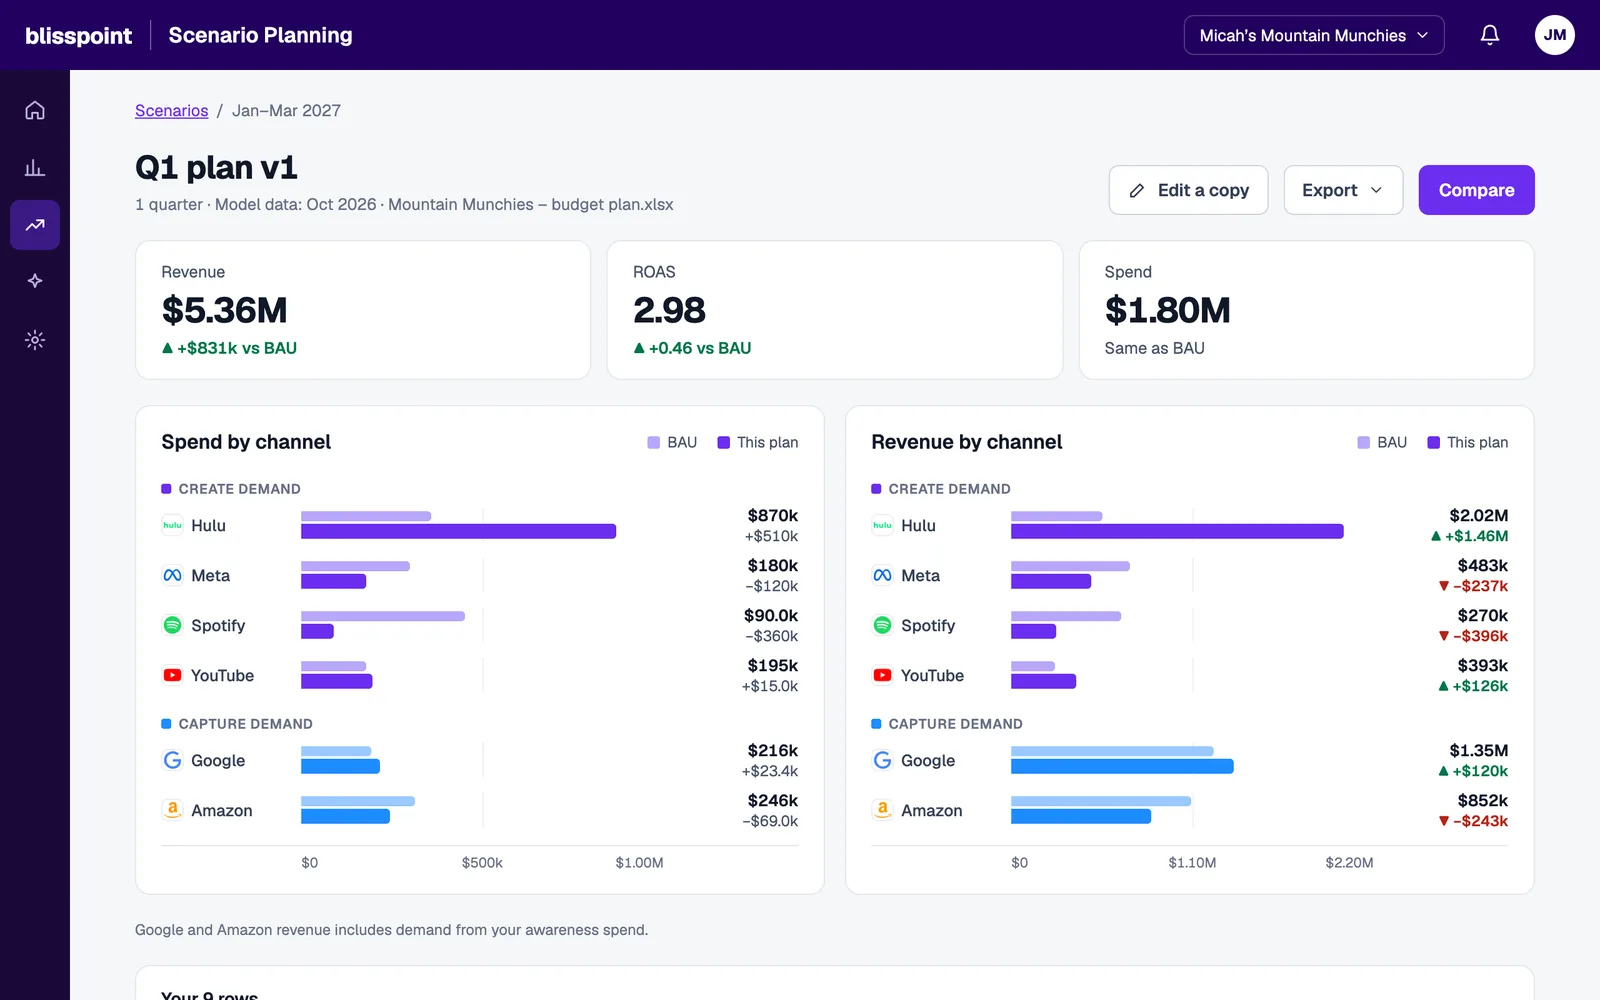
Luckily, we had a backup. We’d planned a spreadsheet upload for people who’d rather type numbers than drag bars, and it ended up being the main way in. Account teams already kept their budgets in spreadsheets. They upload the sheet, check the numbers and click Predict revenue: one set of calculations for the whole plan.
Inside a finished plan
Tap a number to see the thinking behind that detail.
The trade-off
Feel the difference. Switch versions, then change a budget. (Made-up numbers to show the idea.)
Gave up
Instant updates. Revenue no longer moves the moment you change a number.
Gained
One set of calculations per plan instead of billions, no lag, and a starting point teams already had: their own budget spreadsheet.
It worked. No more billions of data points in a single session, and it still looked cool. Revenue no longer moved the instant you changed a number, but our users were still ecstatic.
The people who’d tried the sliders were a little bummed. The ones who never saw them didn’t miss them at all.


I’m oversimplifying for brevity. It was a remarkably complex tool with multiple interaction modes and configuration needs. Of the 180+ pages and tools in Bliss Point, this is one of my proudest.
(Read: I’m really hoping you ask me about this one!)
The result
One of the platform’s biggest selling points.
Scenario Planning set Tinuiti apart from competitors and brought in new customers.
- major direct-to-consumer brands use it
- Dozens
- set of calculations per plan, down from billions with live sliders
- 1

“Can I get a picture?!”
When it debuted at our yearly conference, a marketing leader from one of our biggest brands stopped the demo to ask, because it looked so cool.
Want to talk through this project?
I’d love to walk you through it, including the parts I couldn’t show here. Ask me about:
- How we decided to drop the sliders
- How the client version differs from the internal one
- Why this is one of my proudest projects